/15 min read
In March 2026 Macquarie put 40 percent odds on oil reaching $200. By June the same bank expected an average of $77. Both numbers came out of the same model, with one assumption changed.
Two weeks ago I wrote about a single Panama Canal slot auctioned at US$5.3 million, and what happens when ships are forced to go the long way round. What stayed with me from that piece wasn’t the ships. It was the cargo.
All year the same numbers have been sliding past me: oil at $100, then $120, then $150, even $200. It wasn’t the size of them that nagged, it was how anyone knew.
The number is an output, not a guess
Here is monthly Brent since January 2025, using the spot average the EIA publishes:
The American and Israeli strikes on Iran began on 28 February 2026, and the Strait of Hormuz was effectively shut within days. Brent spot closed at $71.32 on 27 February, the last trading day before the strikes. Five and a half weeks later, on 7 April, it was $138.21. Both are spot prices, from the same EIA series as the chart above. That is the stretch in which all the big numbers appeared.
There is something else in that chart I only noticed while drawing it. The two lines come apart. Through 2025 and into February 2026 the gap between Brent and WTI ran at a median of $3.88; on 15 September 2026 it was $23.78. Both figures are my own arithmetic on the same daily data.
The difference is geographic. WTI is priced at Cushing, Oklahoma, inland, while Brent is the global crude oil price benchmark built on seaborne cargoes, as the EIA puts it. My reading is that a disruption to sea routes hits the seaborne benchmark harder than the one sitting inland. That is my inference from the two lines above rather than something I found written down about this particular crisis, so treat it as a guess.
When I went looking for where each one came from, not one turned out to be a guess. Every one was a long sentence with its assumptions deleted somewhere before the headline.
The full sentence runs roughly like this: if supply loses this many barrels a day, and that lasts this many months, and inventories fall to about here, and demand can only drop by this much, then the price has to reach about here for the market to clear. What reaches the reader is the last number.
The rest of this post is those variables.
How many barrels are actually gone
The EIA, the US government’s energy statistics agency, puts about 20.9 million barrels a day through Hormuz in the first half of 2025, roughly 20 percent of the world’s petroleum liquids consumption. It is an enormous number, and the temptation is to conclude that closing Hormuz costs the world 20.9 million barrels a day.
I thought that for a while, and it is wrong. What passes through a strait is not what disappears when the strait shuts.
Some of it reroutes by pipeline. Brookings calculates that the Saudi line to Yanbu and the Emirati line to Fujairah hold about 5.7 million barrels a day of spare headroom, once you subtract what was already in use before the war. Some is covered from inventories. And some simply stops being wanted, because demand falls too.
What actually halts is far smaller than what passes. The EIA recorded shut-in supply averaging 6.7 million barrels a day through August 2026, up from 5.0 million in July.
Now set that against the cushions:
This is why the price didn’t go straight to $200 in the first month. The cushions were doing their job.
But a cushion has one dangerous property: eventually it runs out. And on 10 September 2026 the largest cushion was itself attacked. The Saudi east-to-west pipeline, which had been moving four to five million barrels a day to Yanbu as the kingdom’s main way around Hormuz, was shut after drone strikes.
One thing needs correcting here, because I linked it wrongly myself at first. The strikes came from Maysan province in Iraq, and as of Al Jazeera’s report no group had claimed responsibility. The Houthis were not named.
What happened was not one actor hitting two places. It was two separate pressures converging on the same cushion, because in that same week the southern end of the Red Sea also changed hands.
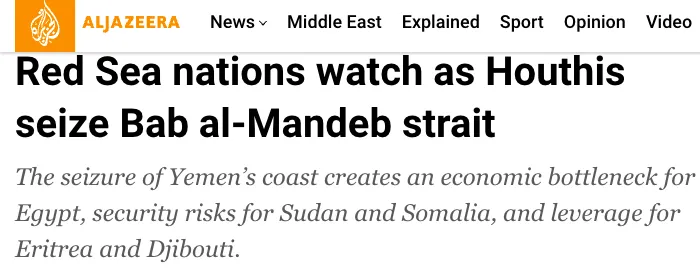
Al Jazeera, 13 September 2026. Between 10 and 12 September the Houthis took Mocha, Dhubab and Perim Island, which splits Bab el-Mandeb.
Hormuz and Bab el-Mandeb are better kept apart, because different things drive them. Hormuz is shut because of the war with Iran. Bab el-Mandeb is under pressure from the Houthis, who declared a naval blockade of Saudi Arabia on 20 July 2026.
The volumes differ sharply too. The EIA has Bab el-Mandeb carrying 9.3 million barrels a day in 2023 and 4.1 million by 2024, with liquefied natural gas at zero since 2024. For gas there is nothing further to lose there.
What matters is not the volume but the position. Bab el-Mandeb had always been counted as a risk to shipping routes. In September 2026 its position turned it into a risk to the way out of Yanbu, which is a different matter.
There is a cost that appears on no chart. On 11 August 2026 the cargo ship Tihamah was hit by missiles in Bab el-Mandeb, and six people aboard were killed, one of them Indonesian. The UN recorded the same attack.
How long it lasts
Losing five million barrels a day for three days and for six months are two different events, even though the number is the same. Inventories can patch the first. The second has to be patched by raising the price until some demand gives up.
The Dallas Fed modelled it in March 2026. All the paths leave from the same point, WTI at $98 in the second quarter of 2026:
| Hormuz shut for | WTI, third quarter | WTI, fourth quarter |
|---|---|---|
| 1 quarter | $68 | $67 |
| 2 quarters | $115 | $76 |
| 3 quarters | $115 | $132 |
Two things in that table are worth pausing on. The two-quarter and three-quarter paths produce an identical third-quarter figure, $115, and then separate sharply in the fourth:
132 − 67 = $65 spread in the fourth quarter
115 − 68 = $47 spread in the third quarter
Both of those are my own arithmetic off the table above. So duration does not raise the price a little at a time. Up to a point the paths look alike, and past it they come apart.
And notice the first path: if the strait reopens within a quarter, the price ends up below where it started.
This is how two analysts can read exactly the same news and publish wildly different numbers. They are not disagreeing about economics, but about when the war ends.
Why demand can’t run away
When prices rise, people usually buy less. With oil, “less” is very little.
A 2015 study by Javan and Zahran in the OPEC Energy Review puts the short-run price elasticity of oil demand across OECD countries between −0.05 and −0.20. Taken at face value that means roughly this:
price +10% × elasticity −0.05 = demand −0.5%
price +10% × elasticity −0.20 = demand −2.0%
That multiplication is mine, and it is deliberately crude: elasticities do not hold in a straight line that far. But the order of magnitude is the point. A ten percent price rise shifts demand by something like one percent.
Which makes sense. A higher pump price is not a reason to stop going to work tomorrow. Aircraft cannot suddenly stop flying, and factories cannot suddenly switch fuel.
The supply side turns out to be just as rigid. A Dallas Fed paper in August 2026 found the US oil supply elasticity at one-month and one-quarter horizons to be effectively zero. Double the price and the wells still don’t arrive next month.
So neither side of the market can move quickly, and yet something has to move for the market to clear. Only the price is left, which is why the price has to move so far.
Once that is in place, the Brookings numbers read as ordinary arithmetic. In May 2026 Robin Brooks and Ben Harris estimated that a roughly 10 percent fall in supply put Brent around $120, approaching $150 once the temporary buffers were exhausted. Those are not two separate forecasts. They are two points on one curve, read at two different inventory levels.
It also explains the shape of that curve. While the cushion is thick, a little more scarcity lifts the price a little. Once the cushion is thin, the same additional scarcity can lift it a great deal more. The market does not move in a straight line.
The physical price and the paper price can come apart
So far this has all been barrels. There is one more layer, and it is the one that most often makes two news stories look like they contradict each other when they don’t.
“The oil price” is not a single number. There are at least two: what a physical cargo changes hands for now, and what a futures contract for next month’s delivery costs. Usually they sit close together. In a crisis they can separate sharply.
The cleanest example comes from April 2026, because both numbers sit in one report. The IEA wrote that physical crude prices surged to record levels near $150 a barrel, far above prices in futures markets, with North Sea Dated touching $144 and its premium over ICE Brent reaching a record $35 a barrel. “Near $150” is their phrase, not my rounding.
The pattern showed again in September 2026, though the evidence is weaker. The EIA spot series printed $130.80 on 15 September, while the November Brent contract settled at $103.87 on 18 September on Bloomberg figures carried by Rigzone. Those dates are three trading sessions apart and prices were falling across all three, so the distance cannot be read as a same-day gap.
The direction still holds, and it matters. The physical price says somebody needed barrels that week and would pay dearly. The futures price says the market expected conditions to improve before November. Both are true at once, because they answer different questions.
So when one story says “oil at $130” and another says “oil at $104” in the same week, neither is necessarily wrong. The thing to check is which price is being quoted, and on what date.
The bank that said $200, then said $77
This is the clearest example I found, and the one I misread longest.
On 27 March 2026 Macquarie put 40 percent odds on oil reaching $200 if the blockade lasted through the second quarter. Not because they thought anyone wanted to pay double, but because in that scenario the price has to climb until enough demand is destroyed.
Then Hormuz eased for a while, which shows up on the first chart as Brent falling from $138.21 on 7 April to $68.53 on 2 July. On 23 June the same bank cut its 2026 Brent forecast to an average of $77.
The temptation here is to subtract $77 from $200 and say the bank changed its mind by $123. I nearly wrote that, and stopped, because the two numbers are not comparable. The $200 is a threshold carrying 40 percent odds and attached to a condition. The $77 is an expected average across a whole calendar year. Subtracting them is exactly the mistake this post is about.
What changed was not the model but one assumption inside it, namely how long the strait stays shut. Change that and the number at the end changes with it. I used to read reversals like that as a sign the analysts were useless; I now read them as a model working exactly as it should.
Wood Mackenzie did the same thing in the open. Their 20 May 2026 report set out three scenarios, and only the most severe, Extended Disruption, produced Brent approaching $200 by the end of 2026, with global demand falling by 6 million barrels a day.
Notice which way that runs. At $200, demand is not strong. Demand is being destroyed, and that is what finally stops the price rising.
So “$200” never meant the world will pay $200. It is the answer to a different question: how high would the price have to go before enough people stopped buying.
Six numbers I watch
After all this, the way I read oil news has changed. A headline about war tells me almost nothing about price. Six numbers do, and all of them are published on a schedule:
- How many million barrels a day have genuinely stopped, rather than how many pass through the strait.
- How long the disruption is expected to last.
- How much inventory is left. The IEA counted a 507 million barrel draw since February 2026, and that is a cushion which does not refill on its own.
- How much spare capacity remains, which the EIA defines as production that can be started within 30 days and held for at least 90.
- How far demand has already fallen.
- How much supply can be rerouted.
When all six move the wrong way together, the pressure towards $150 genuinely builds. When one of them improves, the pressure eases, which is what happened between 16 and 18 September 2026: a signal that the Saudi pipeline would restart was enough to pull prices down for three straight sessions.
There is one thing I still cannot assess, and it deserves saying. Almost all the world’s spare capacity sits behind Hormuz, as the IEA itself explains. The largest cushion against Hormuz closing is inside Hormuz. I have not found a satisfying way to handle that in any of the arithmetic above, and I am not convinced anyone else has either.
A note
The Brent and WTI prices in the first chart are daily spot prices, taken from the EIA’s own data files, series RBRTE and series RWTC, downloaded on 19 September 2026 and read straight out of the files. The series stops on 15 September because that is the last day the EIA had published. Both are spot prices rather than futures contracts, so they will not match any trading app exactly. The $3.88 and $23.78 median gaps above are my own arithmetic on that same daily data.
On what kind of number each one is, since that is the point of the piece. The Dallas Fed and Wood Mackenzie figures are scenarios: both compute “if this, then that”. Macquarie’s $77 is a genuine forecast, an expected 2026 Brent average, while their $200 is a threshold with odds attached and is not a forecast. The Brookings $120 and $150 are two points on one elasticity curve rather than two separate scenarios. The $65 spread, the $47 spread, the elasticity multiplication and the $109 point on the third chart are all my own arithmetic from figures already linked above.
The Dallas Fed figures in the table are WTI, not Brent, and all three paths leave from $98 in the second quarter of 2026.
A few things were left out for want of a solid source. A short-run demand elasticity of −0.02 to −0.04 circulates under the IMF’s name and I could not find it in any IMF paper I was able to open, so the range here is the one from the OPEC Energy Review instead. Worth noting that the journal is published by Wiley and is not an OPEC Secretariat study. A country-by-country spare capacity breakdown also circulates with no source attached, and I dropped it; the figure above 4 million barrels a day is the IEA’s, for the fourth quarter of 2025.
This is about how a number gets built, and it is not investment advice.