/5 min read
How many people marry in Indonesia, when they marry, and how little is actually known about digital invitation adoption — with every figure marked as data, calculation, or guesswork.
One of the opportunities I mentioned in my last post is digital wedding invitations. It’s an interesting market for two reasons that rarely meet: the number of potential buyers can be counted from official records, and nearly all of them buy exactly once in their lives.
Plenty of figures about this market circulate, but most arrive without a source anyone can open. So I’ve used only numbers whose origin I can point to, and I’ve marked what kind each one is: official data, my own calculation, a projection, or a straight illustration.
How many people marry
Here are the national marriage totals from 2020 to 2024, from a Kemenko PMK paper working off BPS, the national statistics agency, and Kemenag, the ministry that registers marriages:
- 2020 — 1,780,364
- 2021 — 1,743,450
- 2022 — 1,719,592
- 2023 — 1,577,439
- 2024 — 1,478,424
End to end that’s 301,940 fewer marriages, down about 17 percent in four years. Turned into an annual rate:
CAGR = (1,478,424 / 1,780,364)^(1/4) − 1 = −4.54% per year
That −4.54 percent is my own calculation from the series above, not a government figure. The distinction matters, and it shows up almost immediately.
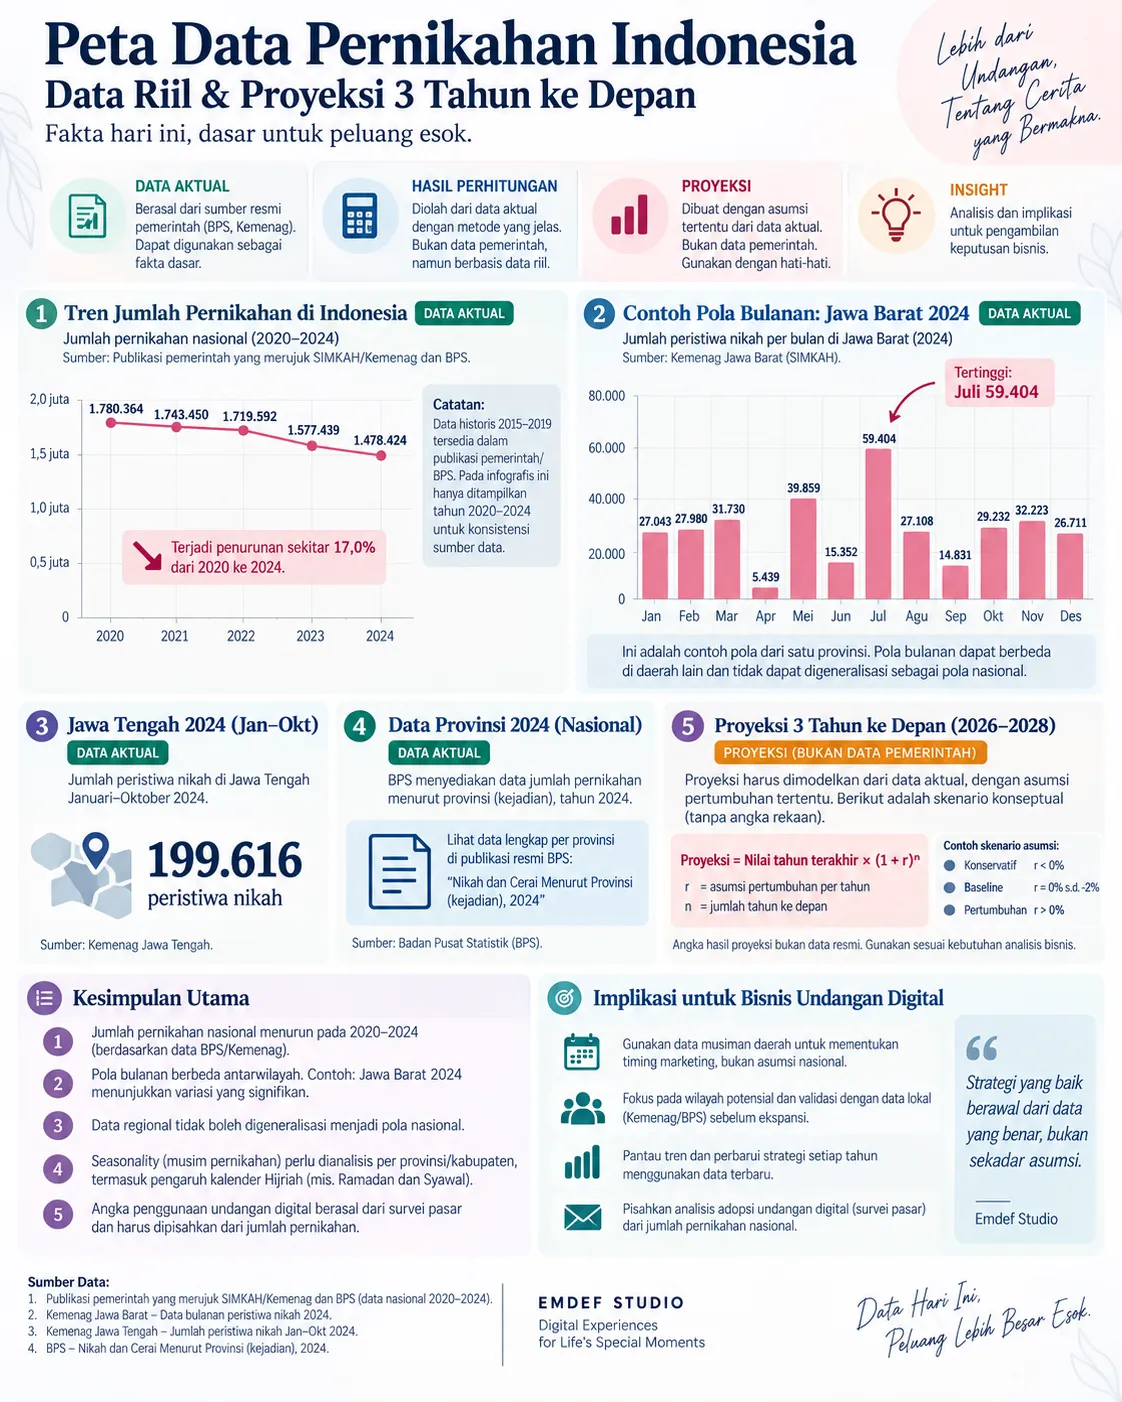
The figures in summary, with each block marked as actual data, calculation, or projection. See it full size.

The line turned out to break
Carry that −4.54 percent forward and 2025 should have landed near 1,411,300.
It didn’t. Kemenag counted 1,480,083 marriages across 2025 — almost 69,000 above the model, and essentially level with the year before.
One caveat so the comparison stays honest: within that same Kemenag series, 2024 reads 1,475,256 rather than the 1,478,424 in the Kemenko PMK paper. Two different records, a small gap between them, but the two are better not mixed inside one sentence.
So what happened isn’t a decline that continues. It’s a decline that stopped. And once a single point misses by that much, extending the line to 2028 collapses into three guesses:
- The decline resumes, −4.54 percent a year — around 1.23 million
- It stays flat, 0 percent — around 1.48 million
- It recovers slightly, +1 percent a year — around 1.54 million
The distance between the gloomiest and the sunniest is 310,000 marriages a year. Four years of data is enough to draw a line, not enough to forecast one.
When they marry
This matters far more than the trend does, and it’s the easiest thing to miss if you only look at annual figures.
Marriages registered in West Java across 2024, busiest month first:
- July — 59,404
- May — 39,859
- November — 32,223
- March — 31,730
- October — 29,232
- February — 27,980
- August — 27,108
- January — 27,043
- December — 26,711
- June — 15,352
- September — 14,831
- April — 5,439
That totals 336,912, roughly 23 percent of every marriage in the country that year. And inside a single province, in a single year, July is eleven times April.
What drives it is the Hijri calendar: quiet through Ramadan, busy after Syawal. Those dates move about ten days a year, so the peak month moves with them. One province doesn’t stand in for the others either — regions have their own favoured months.
For any business selling to people getting married, an eleven-fold swing matters far more than a four percent annual decline. Spend the budget in a quiet month and the busy season is over before you’ve caught up with it.
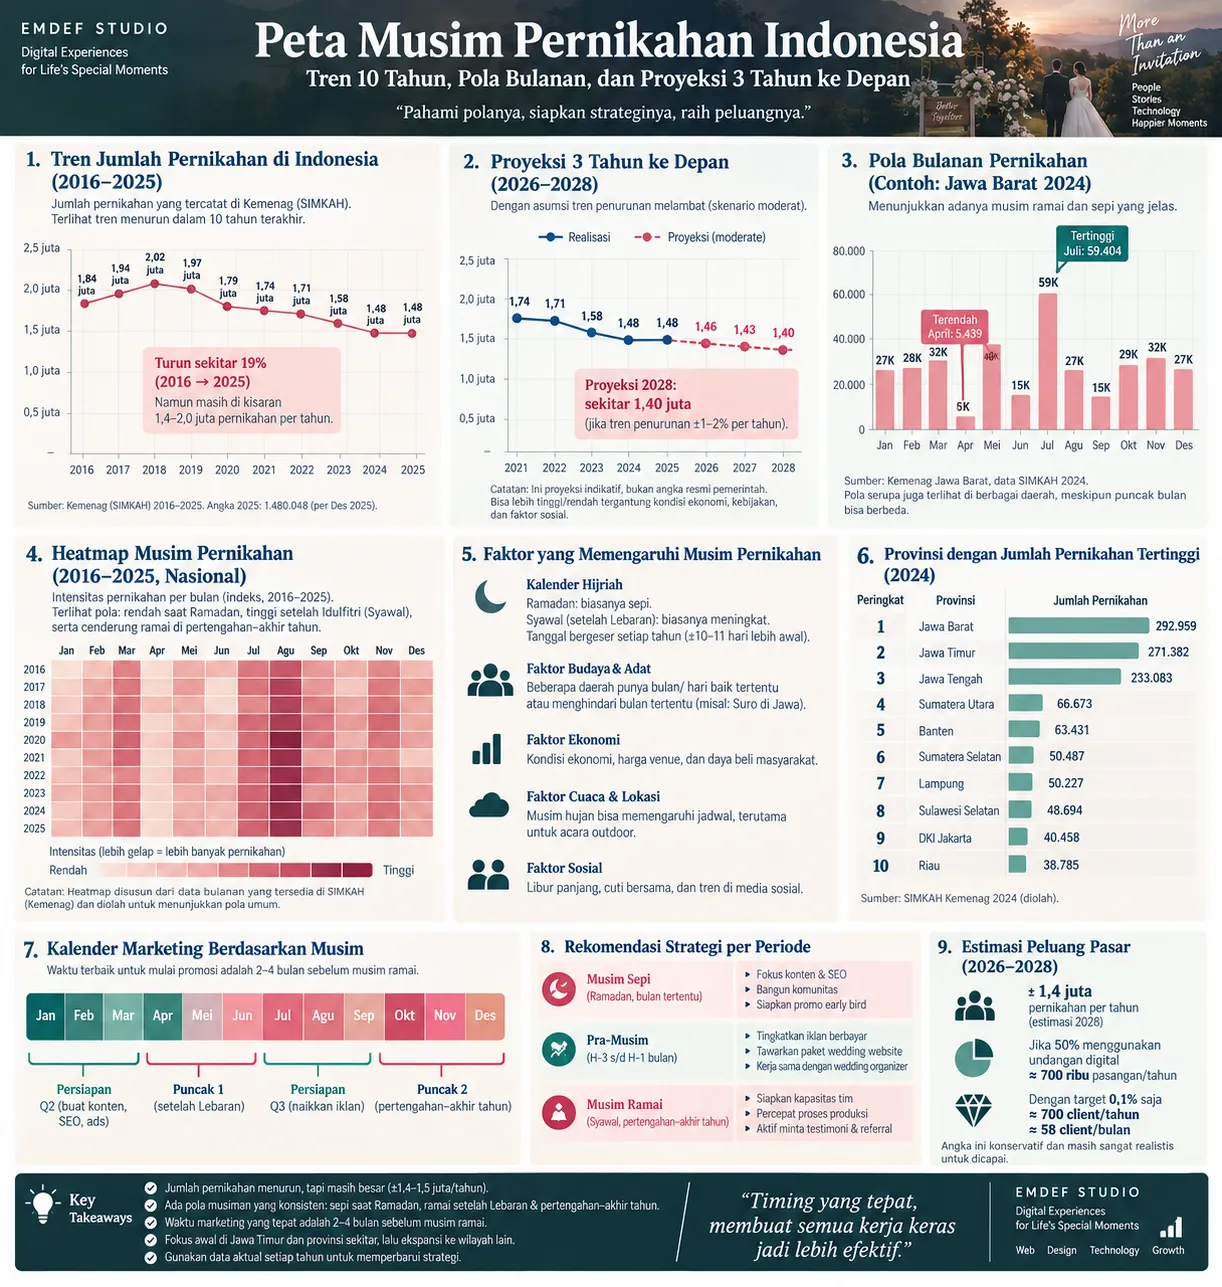
The seasonal pattern and what drives it. The projection panel inside it is a scenario, not an official figure. See it full size.

How many already use digital invitations
This is where the data thins out.
The Bridestory Wedding Trend Survey 2025 reports that 91 percent of its respondents used a digital invitation and 56 percent added a wedding website. The survey covered 5,000 participants — and 94.3 percent of them live in greater Jakarta.
That 91 percent is valid for the people it surveyed, and only for them. Calling it national penetration is plainly wrong. What doesn’t exist yet is the equivalent figure for couples outside the big cities, which is where most of those 1.48 million marriages actually happen.
Why I find this interesting
The size of the market is, roughly, this:
number of marriages × adoption rate × average price
The first term has an official source published every year. The second has one survey with 94 percent of its respondents drawn from a single region. The third has no public reference at all; packages run from tens of thousands to hundreds of thousands of rupiah depending on who is selling.
Fill it in yourself and you get this:
1.3 million × 30% × Rp150,000 = Rp58.5 billion
1.5 million × 50% × Rp150,000 = Rp112.5 billion
At a glance both look equally reasonable. Both are also illustrations rather than data — I invented the 30 percent, the 50 percent and the Rp150,000, precisely to show one thing: nudging two assumptions that nobody actually knows is enough to almost double the answer.
Which means anyone quoting a value for the Indonesian digital invitation market is multiplying one number they know by two they don’t.
And that’s what makes it interesting. The least known term — how many couples outside the big cities already use digital invitations — is the one that decides the answer. No report is going to settle it. It has to be found out first-hand, and whoever finds out first holds something that can’t be copied off the internet.
There are three things I can say with confidence: there are about 1.48 million marriages a year, the number stopped falling in 2025, and the busiest month can be eleven times the quietest. The rest is calculation, projection or illustration, and I’ve tried not to blur the difference. When the source isn’t strong enough, the number is better left off the page than dressed up as a fact.
One small note: the “Emdef Studio” mark on both infographics is a business name I used to trade under, and no longer use.